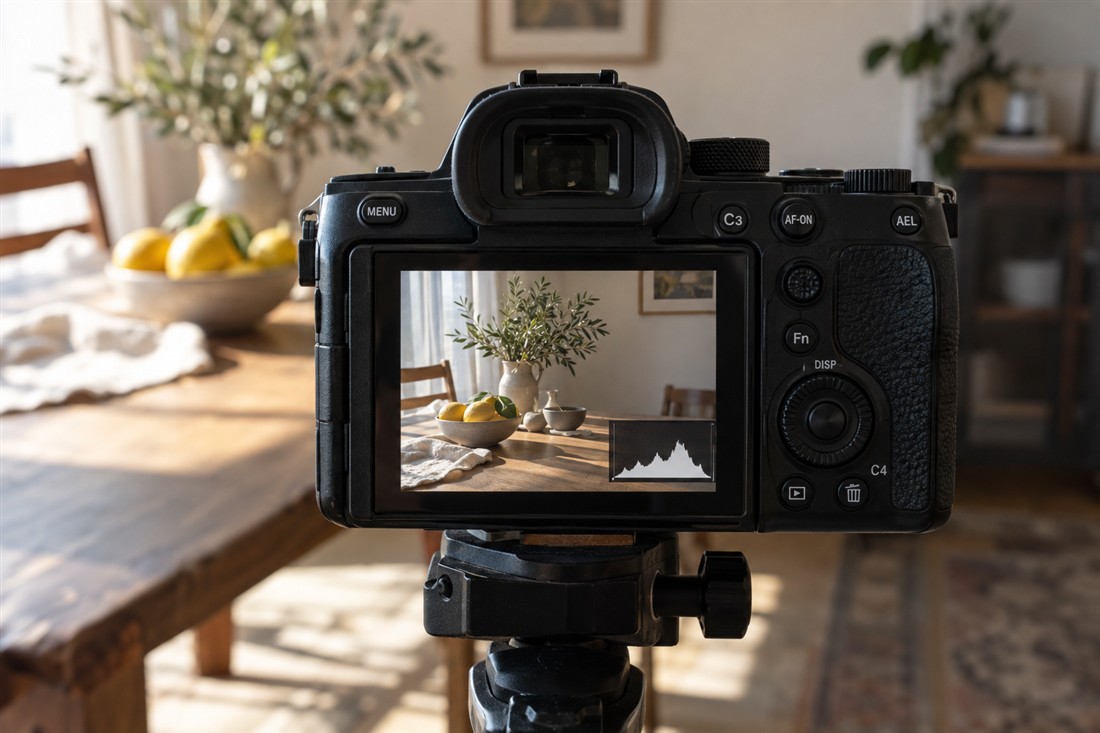
A camera screen can look bright or dim depending on its settings and the light around you. A histogram offers another way to inspect the tonal distribution of a photograph. It does not judge the composition or tell you what every pixel represents. Use it together with the image to decide whether an important bright area may have lost detail.
Read the graph as a distribution
In a typical luminance histogram, dark values are represented toward the left and bright values toward the right. The height shows how much image information falls in that part of the range. A snowy scene naturally differs from a dark room, so there is no ideal central mound for every photograph. Adobe’s histogram documentation explains the relationship between tonal values and the graph. Learn the display your own camera or editor provides rather than treating every version as identical.
Connect the right edge to the picture
A concentration at the bright edge can indicate clipped highlights. Look at the corresponding photograph: is the relevant area a small reflection, the sun or a white shirt whose texture matters? A tiny specular highlight may be acceptable while a featureless face or product label is a serious problem.
Use a highlight warning or channel display where available to investigate further. The graph alone does not identify the object responsible. Coloured subjects may also need attention to individual channels rather than only a combined brightness display.
Make one exposure comparison
Reduce exposure slightly using the control appropriate to your camera and take another frame. Compare the important bright area and check what happened to the subject’s darker parts. Do not push the entire image into unreadable shadow solely to keep one unimportant reflection away from the edge. If the scene contains more contrast than your chosen capture can usefully show, change the light, position or timing rather than treating the histogram as a command to solve everything numerically.
Remember what the preview represents
Check your camera documentation to understand how its histogram relates to the recorded file and picture settings. A preview-based display is not an absolute inventory of everything recoverable from a RAW file. During editing, inspect the image while using clipping indications and restrained tonal adjustments. If no meaningful detail remains in an area, making it darker may only reveal a flat grey patch. Keep the original so later comparisons do not depend on one irreversible correction.
A histogram is most useful when it prompts a specific visual question: which highlight is approaching the limit, and does that detail matter? Read the graph, locate the area in the photograph and make a comparison. Preserve intentional brightness while protecting the details that carry the picture.